Showing posts with label Stock portfolio. Show all posts

Thursday, April 3, 2025

Mastering Trading Strategies: The Power of Regression Analysis and Confidence Limits to Forecast the S&P 500

In the fast-paced world of financial markets, quantitative analysis plays a crucial role in informing trading decisions and strategies. Regression analysis is a powerful tool in a quantitative trader's arsenal, which allows for exploring relationships between variables and predicting future outcomes. This blog post delves into regression analysis using weekly closing prices of the S&P 500 index as the dataset. By leveraging regression output and statistical measures, valuable insights into market trends are uncovered, along with an exploration of how traders can use confidence limits derived from regression analysis to reinforce their short-term trading strategies. This journey bridges the gap between statistical analysis and practical trading applications in the dynamic world of finance.

Why Linear Regression?

When quantitative traders are primarily interested in forecasting S&P 500 closing values as a function of time, it would be more straightforward to create a linear regression model using only the "Time" variable (calculated as the number of weeks since the weekly close) as the predictor, with S&P 500 closing prices as the response.

In this case, traders will use Time as the independent variable and the S&P 500 closing prices as the dependent variable in the regression model. By fitting a regression model with Time as the predictor, traders are essentially estimating the trend or pattern in S&P 500 closing prices over time.

Here's how traders can create the simple regression model:

1.   The dataset must be organized with Time as the independent variable (predictor variable) and the S&P 500 closing prices as the dependent variable.

2.   A simple linear regression analysis must be run with Time as the independent variable and S&P 500 closing prices as the dependent variable.

3.   The regression output should be examined to understand the relationship between Time and closing prices, paying attention to the Time coefficient to determine the change rate over Time.

4.   The regression equation generated by the model must be used to forecast future closing prices based on the projected time values. The time values for the forecast period must be input into the equation to obtain the corresponding forecasted closing prices.

5.   The accuracy of the model's forecasts should be assessed by comparing the predicted closing prices to the actual values once they are available for the forecasted period.

By using a simple regression model with Time as the predictor, traders can focus on the trend in S&P 500 closing prices over Time without additional variables such as Open-Close, High-Low ratios, etc.
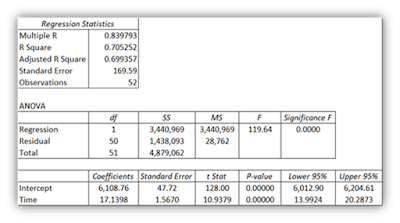
(Click on the image to enlarge)

Explanation of the Methodology

Here is a step-by-step summary starting from the initial regression and then discussing how to utilize confidence limits for trading strategies:

1. Regression Model Basics:

· Conducting a simple regression analysis using the weekly closing prices of the S&P 500 from April 2024 to March 2025.

· Developing a regression model using the weekly S&P 500 closing prices as the dependent variable and Time (number of weeks since the weekly closings) as the independent variable.

· Examining the regression output: the coefficients for the Intercept, Time, and statistical measures such as R-squared and significance levels.

2. Regression Output:

· Intercept: 6,108.76

· Coefficient for Time: 17.1398

· R-squared: 0.705252

· Significance levels, standard errors, and other relevant statistical measures were examined.

· Regression Equation: The core of the model is the regression equation: S&P 500 Price = Intercept + (Time Coefficient * Time)

3. Forecasting Process:

· Inputting Time: Using future "Time" values (0, 1, 2, 3, etc.) to represent the next few weeks.

· Point Forecast: A weekly forecast by plugging the "Time" values into the regression equation.

4. Confidence Limits:

· Identifying the lower and upper 95% confidence limits for the coefficients (Intercept and Time) in the regression output.

· Lower 95% Confidence Limit: Indicating the lower boundary within which the actual value of the coefficient is likely to fall with 95% confidence.

· Upper 95% Confidence Limit: Indicating the upper boundary within which the actual value of the coefficient is likely to fall with 95% confidence.

5. Applying Confidence Limits (Example):

·   Week 1 (Time = 0):

o   Lower Bound: 6108.76 + (13.9924 * 0) = 6108.76

o   Upper Bound: 6108.76 + (20.2873 * 0) = 6108.76

o   Range: 6108.76 to 6108.76 (In this case, the range is the same because multiplying by 0 eliminates the effect of the coefficient)

·   Week 2 (Time = 1):

o   Lower Bound: 6108.76 + (13.9924 * 1) = 6122.75 (approximately)

o   Upper Bound: 6108.76 + (20.2873 * 1) = 6129.05 (approximately)

o   Range: 6122.75 to 6129.05

·   Week 3 (Time = 2):

o   Lower Bound: 6108.76 + (13.9924 * 2) = 6136.75 (approximately)

o   Upper Bound: 6108.76 + (20.2873 * 2) = 6149.33 (approximately)

o   Range: 6136.75 to 6149.33

·   Week 4 (Time = 3):

o   Lower Bound: 6108.76 + (13.9924 * 3) = 6150.75 (approximately)

o   Upper Bound: 6108.76 + (20.2873 * 3) = 6169.61 (approximately)

o   Range: 6150.75 to 6169.61

By integrating the regression analysis findings with confidence limits into trading strategies, traders can implement a data-driven approach to risk management and optimize profit-taking. This methodology emphasizes the importance of combining statistical analysis with market knowledge to improve short-term trading decisions.

Trading Strategy Implementation

Quantitatively savvy traders can use the lower and upper 95% confidence limits as stop-loss and take-profit levels for existing trades. These confidence limits provide a range within which the actual values of the dependent variable (in this case, S&P 500 prices) are likely to fall. Using these confidence limits as stop-loss and take-profit levels can help traders set trade boundaries based on statistical analysis.

Here's how traders could potentially utilize the lower 95% and upper 95% confidence limits:

1.  Stop-Loss Level (Lower 95% Confidence Limit): If a trader is holding a long position in the S&P 500, and the current price approaches the lower 95% confidence limit (e.g., if the price is close to or falls below the lower bound, it could signal a potential downside risk. In such a scenario, the trader may consider setting a stop-loss order at or just below the lower limit (similar to the technical support level) to limit potential losses if the price continues declining.

2.  Take-Profit Level (Upper 95% Confidence Limit): Conversely, if a trader is holding a position in the S&P 500 and the current price is nearing the upper 95% confidence limit (e.g., close to or above the upper bound) but is unable to breakout (similar to the technical resistance level), it indicates a potential upside risk. In this case, the trader may consider setting a take-profit order at or below the upper limit to secure profits if the price reaches that level.

Using confidence limits as stop-loss and take-profit levels can give traders a quantitative, statistically driven approach to managing risk and locking in profits. However, it's essential to consider other factors, such as market conditions, trend analysis, and overall risk management strategies, in conjunction with statistical analysis to make well-informed trading decisions.

Suitability of the Strategy for Long-term Investors

While using confidence limits as stop-loss and take-profit levels can be valuable for short-term quantitative traders seeking to manage risk and secure profits in the near term, their application may be less relevant for long-term investors with a different investment horizon and approach. Here are some reasons why:

1.  Time Horizon: Long-term investors typically have an investment horizon ranging from several years to decades, focusing on the fundamentals of the asset and its growth potential over the long term. In contrast, short-term quantitative traders aim to capitalize on short-term price movements based on statistical analysis and market trends.

2.  Volatility and Noise: Short-term price fluctuations and market volatility can cause the price to move within the confidence limits frequently, leading to frequent stop-loss and take-profit triggers for short-term traders. Conversely, long-term investors may be more concerned with the overall trend and sustainable asset growth than short-term fluctuations.

3.  Risk Tolerance: Long-term investors often have a higher tolerance for market fluctuations and are willing to withstand short-term price movements in anticipation of long-term gains. They may not be as focused on setting precise stop-loss or take-profit levels based on statistical confidence limits.

4.  Fundamental Analysis: Long-term investors typically base their investment decisions on fundamental analysis, focusing on factors such as company performance, industry trends, economic indicators, and qualitative aspects of the asset. Statistical confidence limits derived from regression analysis may not directly align with the fundamental factors considered by long-term investors.

In summary, while using confidence limits as stop-loss and take-profit levels can benefit short-term quantitative traders seeking to optimize trading strategies, it may not be the primary approach for long-term investors focused on fundamental analysis and a buy-and-hold strategy over an extended period. Each approach caters to different investment goals, risk profiles, and time horizons.

Conclusion

In the trading world, the marriage of statistical analysis and market knowledge can be potent for making informed decisions and managing risk effectively. Exploring regression analysis and applying confidence limits as stop-loss and take-profit levels sheds light on the intersection of quantitative methods and trading strategies. By harnessing insights from regression outputs and confidently setting boundaries for their trades, traders are better equipped to navigate the complex landscape of financial markets with greater precision. As the discussion concludes, traders are encouraged to embrace regression analysis and other statistical tools as valuable resources in their quest for trading success. It underscores that knowledge is power in quantitative trading, and data-driven decisions pave the way to profitable outcomes.

Disclaimer: The information provided in this blog post is for educational and informational purposes only. While the content explores the application of regression analysis and confidence limits in trading strategies, it is not intended as financial advice or a recommendation for specific trading actions. Trading in financial markets carries inherent risks, and individuals should conduct thorough research, consider personal financial goals and risk tolerance, and seek professional advice before making any trading decisions. Statistical analysis and confidence limits in trading strategies should be approached cautiously and do not guarantee successful outcomes. The author and platform disclaim any responsibility for the outcomes of trading decisions made based on the content presented in this blog post.

Sid's Bookshelf: Elevate Your Personal and Business Potential


Thursday, August 29, 2024

Sid's Bookshelf: Elevate Your Personal and Business Potential

Note: These books are also available on Amazon in Paperback and Hardcover versions

24. Revolutionizing Property Tax Assessment: Navigating a Shifting Real Estate Market in the Era of Declining Commercial Tax Revenue

                                    Kindle Version

                                    PDF Version

23. The Art and Science of Comparable Sales Analysis in Property Valuation

                Kindle Version

                                 PDF Version

22. Mastering Mass Appraisal Modeling: A Hands-On Guide with Real-World Data

                    Kindle Version

                        PDF Version

21. From Basics to Breakthroughs: A Beginner's Journey in Data Analysis and Modeling in Excel

                    Kindle Version

                             PDF Version

20. A Beginner’s Guide to Automated Valuation Modeling (AVM): Step-by-Step Demonstration of Model Development with Real-World Data and Numerous Illustrations

                Kindle Version

                        PDF Version

19. A Beginner's Guide to Hands-on Statistical Analysis and Modeling in Excel with Housing Case Studies

                Kindle Version

                     PDF Version

18. Bailing out the Dysfunctional US Property Tax System

            Kindle Version

                    PDF Version

17B.  Revolutionizing Resale: An AI-Assisted Guide to Tesla Model Y Market Trends for Consumers and Industry Analysts

                Kindle Version

                PDF Version

17A. Data-Driven Decisions: Unlocking the Tesla Model 3 Resale Market and Buying Strategies with AI

               Kindle Version

               PDF Version

 16. The AI Advantage: Strategic Retirement Planning for New Professionals 

         Kindle Version

             PDF Version

15. From Stay-at-Home to Successful Entrepreneurs: AI-Assisted Property Assessment Appeals

             Kindle Version            

             PDF Version

14. Mastering Assessment Ratio Challenges: A Comprehensive AI-Enhanced Guide for Appraisers and Property Tax Professionals

         Kindle Version               

              PDF Version

13. AI-Assisted Property Assessment Appeals: A Comprehensive Guide to Winning Your Case and Reducing Property Taxes with Advanced Strategies

            Kindle Version

            PDF Version

12. Automated Valuation Modeling (AVM) Made Easy: A Beginner's Guide with Interactive AI Chatbot ChatGPT and Real-World Data

            Kindle Version

            PDF Version

11. AI-Curated Wedding Menus: A Comprehensive Guide to Menu Planning and Cost Management

            Kindle Version

            PDF Version

10. The AI Revolution: Reshaping the Future of Work

            Kindle Version

            PDF Version

9. AI Revolutionizing Real Estate: Exploring Case Shiller Index for Smart Predictions

            Kindle Version

            PDF Version

8. AI Investing 101: A Comprehensive Guide for New Investors in the Stock Market

            Kindle Version

            PDF Version

7. Revolutionizing Data Analysis and Modeling with AI: A Hands-On Guide

            Kindle Version

            PDF Version

6. AI Unleashed: Mastering the Art of Investing in Magnificent Seven Bellwether Stocks

            Kindle Version

            PDF Version

5. Mastering the Stock Market with AI: Advanced Analysis and Strategic Techniques

            Kindle Version

            PDF Version

4. The Conversational AI Revolution: How ChatGPT and Bard Are Changing the Way We Communicate

            Kindle Version

            PDF Version

3. The Future of Housing: A Guide to AI-Powered Real Estate Solutions

            Kindle Version

            PDF Version

2. How to Use AI Chatbot Bard to Master Data Analysis and Modeling

            Kindle Version

            PDF Version

1. Conversations with ChatGPT: Exploring the Future of Humanity (Updated 2.0 is available)

            Kindle Version 

            PDF Version


Saturday, December 30, 2023

Sid's Books on AI-Assisted Business Applications

                       AI-Assisted Business Applications

15. The AI Advantage: Strategic Retirement Planning for New Professionals 

              Kindle Version

                        PDF Version

14. From Stay-at-Home to Successful Entrepreneurs: AI-Assisted Property Assessment Appeals

             Kindle Version            

             PDF Version

13. Mastering Assessment Ratio Challenges: A Comprehensive AI-Enhanced Guide for Appraisers and Property Tax Professionals

         Kindle Version               

              PDF Version

12. AI-Assisted Property Assessment Appeals: A Comprehensive Guide to Winning Your Case and Reducing Property Taxes with Advanced Strategies

            Kindle Version

            PDF Version

11. Automated Valuation Modeling (AVM) Made Easy: A Beginner's Guide with Interactive AI Chatbot ChatGPT and Real-World Data

            Kindle Version

            Paperback Version

10. The AI Revolution: Reshaping the Future of Work

            Kindle Version

            Paperback Version

9. AI Revolutionizing Real Estate: Exploring Case Shiller Index for Smart Predictions

            Kindle Version

            Paperback Version

8. AI Investing 101: A Comprehensive Guide for New Investors in the Stock Market

            Kindle Version

            Paperback Version

7. Revolutionizing Data Analysis and Modeling with AI: A Hands-On Guide

            Kindle Version

            Paperback Version

6. AI Unleashed: Mastering the Art of Investing in Magnificent Seven Bellwether Stocks

            Kindle Version

            Paperback Version

5. Mastering the Stock Market with AI: Advanced Analysis and Strategic Techniques

            Kindle Version

            Paperback Version

4. The Conversational AI Revolution: How ChatGPT and Bard Are Changing the Way We Communicate

            Kindle Version

            Paperback Version

3. The Future of Housing: A Guide to AI-Powered Real Estate Solutions

            Kindle Version

            Paperback Version

2. How to Use AI Chatbot Bard to Master Data Analysis and Modeling

            Kindle Version

            Paperback Version

1. Conversations with ChatGPT: Exploring the Future of Humanity (Updated 2.0 is aviable)

            Kindle Version 

            Paperback Version

Monday, October 2, 2023

Sid's Books on Artificial Intelligence (AI)

AI-Assisted Personal & Business Applications 

1. The AI Revolution: Reshaping the Future of Work

            Kindle Version

            Paperback Version

2. AI Revolutionizing Real Estate: Exploring Case Shiller Index for Smart Predictions

            Kindle Version

            Paperback Version

3. AI Investing 101: A Comprehensive Guide for New Investors in the Stock Market

            Kindle Version

            Paperback Version

4. Revolutionizing Data Analysis and Modeling with AI: A Hands-On Guide

            Kindle Version

            Paperback Version

5. AI Unleashed: Mastering the Art of Investing in Magnificent Seven Bellwether Stocks

            Kindle Version

            Paperback Version

6. Mastering the Stock Market with AI: Advanced Analysis and Strategic Techniques

            Kindle Version

            Paperback Version

7. The Conversational AI Revolution: How ChatGPT and Bard Are Changing the Way We Communicate

            Kindle Version

            Paperback Version

8. The Future of Housing: A Guide to AI-Powered Real Estate Solutions

            Kindle Version

            Paperback Version

9. How to Use AI Chatbot Bard to Master Data Analysis and Modeling

            Kindle Version

            Paperback Version

10. Conversations with ChatGPT: Exploring the Future of Humanity

            Kindle Version 

            Paperback Version


Wednesday, July 12, 2023

Google Bard assists me with "Magnificent 7" stocks. Quite impressive!

The "Magnificent 7" refers to a group of seven leading tech companies: Meta Platforms, Apple, Amazon, Google, Microsoft, Nvidia, and Tesla. These companies have consistently been top performers in the market, driving innovation in their respective fields and contributing significantly to the global economy.

Despite being highly volatile, these companies have solid long-term track records and are profitable, returning significant value to their shareholders. The term was coined by Jim Cramer of CNBC in 2023, and since then, it has been widely adopted by investors and analysts. While risks are involved, these companies are well-positioned for continued growth in the future.

(Click on the image to enlarge)

Sid: I have compiled both fundamental and technical indicators for the "Magnificent 7" stocks from 2023 until now. Please assess these indicators and make a decisive recommendation on whether I should buy, hold, or sell these stocks. You may also consider other relevant information, such as revenue growth, return on equity, current ratio, and competition, to supplement your analysis and prediction.

Bard: Sure, I can help you with that. Here are my recommendations for the "Magnificent 7" stocks:

Apple (AAPL)

·       Fundamental indicators: AAPL has a strong fundamental profile, with a high profit margin and a growing dividend. However, the stock is also relatively expensive, with a high PE ratio.

·       Technical indicators: AAPL's technical indicators are mixed. The 50-day moving average is above the 200-day moving average, which is a bullish signal. However, the 100-day stochastic is overbought, which could signal a sell.

·       Recommendation: I would hold AAPL. The stock is a good long-term investment, but it may be overvalued in the short term.

Amazon (AMZN)

·       Fundamental indicators: AMZN has a strong fundamental profile, with a high profit margin and a growing revenue. However, the stock is also relatively expensive, with a high PE ratio.

·       Technical indicators: AMZN's technical indicators are bearish. The 50-day moving average is below the 200-day moving average, and the 100-day stochastic is oversold.

·       Recommendation: I would sell AMZN. The stock is overvalued and is in a downtrend.

Alphabet (GOOG)

·       Fundamental indicators: GOOG has a strong fundamental profile, with a high profit margin and a growing revenue. However, the stock is also relatively expensive, with a high PE ratio.

·       Technical indicators: GOOG's technical indicators are mixed. The 50-day moving average is above the 200-day moving average, which is a bullish signal. However, the 100-day stochastic is overbought, which could signal a sell.

·       Recommendation: I would hold GOOG. The stock is a good long-term investment, but it may be overvalued in the short term.

Meta (META)

·       Fundamental indicators: META has a weak fundamental profile, with a declining profit margin and a slowing revenue growth. However, the stock is relatively cheap, with a low PE ratio.

·       Technical indicators: META's technical indicators are bearish. The 50-day moving average is below the 200-day moving average, and the 100-day stochastic is oversold.

·       Recommendation: I would sell META. The stock is undervalued, but it is also in a downtrend.

Microsoft (MSFT)

·       Fundamental indicators: MSFT has a strong fundamental profile, with a high profit margin and a growing revenue. However, the stock is also relatively expensive, with a high PE ratio.

·       Technical indicators: MSFT's technical indicators are bullish. The 50-day moving average is above the 200-day moving average, and the 100-day stochastic is in the neutral zone.

·       Recommendation: I would buy MSFT. The stock is a good long-term investment, and it is currently trading at a reasonable valuation.

Nvidia (NVDA)

·       Fundamental indicators: NVDA has a strong fundamental profile, with a high profit margin and a growing revenue. However, the stock is also relatively expensive, with a high PE ratio.

·       Technical indicators: NVDA's technical indicators are bullish. The 50-day moving average is above the 200-day moving average, and the 100-day stochastic is in the neutral zone.

·       Recommendation: I would buy NVDA. The stock is a good long-term investment, and it is currently trading at a reasonable valuation.

Tesla (TSLA)

·       Fundamental indicators: TSLA has a weak fundamental profile, with a declining profit margin and a slowing revenue growth. However, the stock is relatively cheap, with a low PE ratio.

·       Technical indicators: TSLA's technical indicators are bearish. The 50-day moving average is below the 200-day moving average, and the 100-day stochastic is oversold.

·       Recommendation: I would sell TSLA. The stock is undervalued, but it is also in a downtrend.

Overall, I would recommend buying MSFT and NVDA, holding AAPL and GOOG, and selling AMZN, META, and TSLA.

Please note that this is just my opinion, and you should always do your own research.

Sid: Please provide the latest Sentiment and SWOT analyses for each stock.

Bard: Sure, here are the latest Sentiment and SWOT analyses for each stock:

AAPL | Positive |

·       Strengths: Strong brand, loyal customer base, growing revenue and earnings.

·       Weaknesses: High valuation, increasing competition from other tech giants.

·       Opportunities: Growth in the mobile market, expansion into new markets.

·       Threats: Economic slowdown, regulatory scrutiny.

AMZN | Mixed |

   ·       Strengths: Leader in the e-commerce and cloud computing industries, strong brand, loyal customer base.

·       Weaknesses: High valuation, increasing competition from other e-commerce companies, regulatory scrutiny.

·       Opportunities: Growth in the e-commerce and cloud computing markets, expansion into new markets.

·       Threats: Economic slowdown, regulatory scrutiny.

GOOG | Positive |

   ·       Strengths: Strong brand, dominant position in the search engine market, growing revenue and earnings.

·       Weaknesses: High valuation, increasing competition from other tech giants.

·       Opportunities: Growth in the digital advertising market, expansion into new markets.

·       Threats: Economic slowdown, regulatory scrutiny.

META | Negative |

   ·       Strengths: Strong brand, dominant position in the social media market.

·       Weaknesses: Declining user growth, increasing competition from other social media platforms, regulatory scrutiny.

·       Opportunities: Growth in the metaverse market, expansion into new markets.

·       Threats: Economic slowdown, regulatory scrutiny.

MSFT | Positive |

   ·       Strengths: Strong brand, dominant position in the PC operating system market, growing revenue and earnings.

·      Weaknesses: High valuation, increasing competition from other tech giants.

·      Opportunities: Growth in the cloud computing market, expansion into new markets.

·      Threats: Economic slowdown, regulatory scrutiny.

NVDA | Positive |

   ·       Strengths: Strong brand, dominant position in the graphics processing unit (GPU) market, growing revenue and earnings.

·       Weaknesses: High valuation, increasing competition from other tech giants.

·       Opportunities: Growth in the artificial intelligence (AI) market, expansion into new markets.

·       Threats: Economic slowdown, regulatory scrutiny.

TSLA | Mixed |

   ·       Strengths: Strong brand, leading position in the electric vehicle market, growing revenue and earnings.

·       Weaknesses: High valuation, increasing competition from other electric vehicle manufacturers, regulatory scrutiny.

·       Opportunities: Growth in the electric vehicle market, expansion into new markets.

·       Threats: Economic slowdown, regulatory scrutiny.

Please note that these are just my own opinions, and they should not be considered financial advice. It is always important to do your own research before making any investment decisions.


50% Off This Weekend Only – Five Practical Valuation Modeling Books

This weekend only, I’m running a straightforward 50% off campaign on the PDF editions of my five most recent valuation modeling books. The...